
The probability of winning tells you how likely a defined result is—not how much money that result is worth. A game can award prizes frequently and still cost players money on average. Another may offer a huge jackpot with an extremely small chance of success. To compare games accurately, separate three questions: What counts as a win? How often can it happen? What is the net result when it does?
A hypothetical lottery provides a useful test: matching six numbers drawn from 40 has a probability of 1 in 3,838,380 per line. If a separate bonus ball is drawn from 14 numbers, the combined top outcome has a probability of 1 in 53,737,320. These are illustrative models, not the rules of a UK lottery.

What does the probability of winning mean?
A probability is a number between 0 and 1. Zero represents an impossible event, 1 represents certainty, and 0.5 represents a 50% chance. Probabilities can be expressed as fractions, decimals, percentages or “1 in N” figures.
In game mathematics, a trial is one play, spin, draw or other experiment. The sample space contains every possible outcome. A winning event is the set of outcomes that satisfy the win condition. With equally likely outcomes, the basic formula is:
P(win) = number of favourable outcomes ÷ number of possible outcomes.
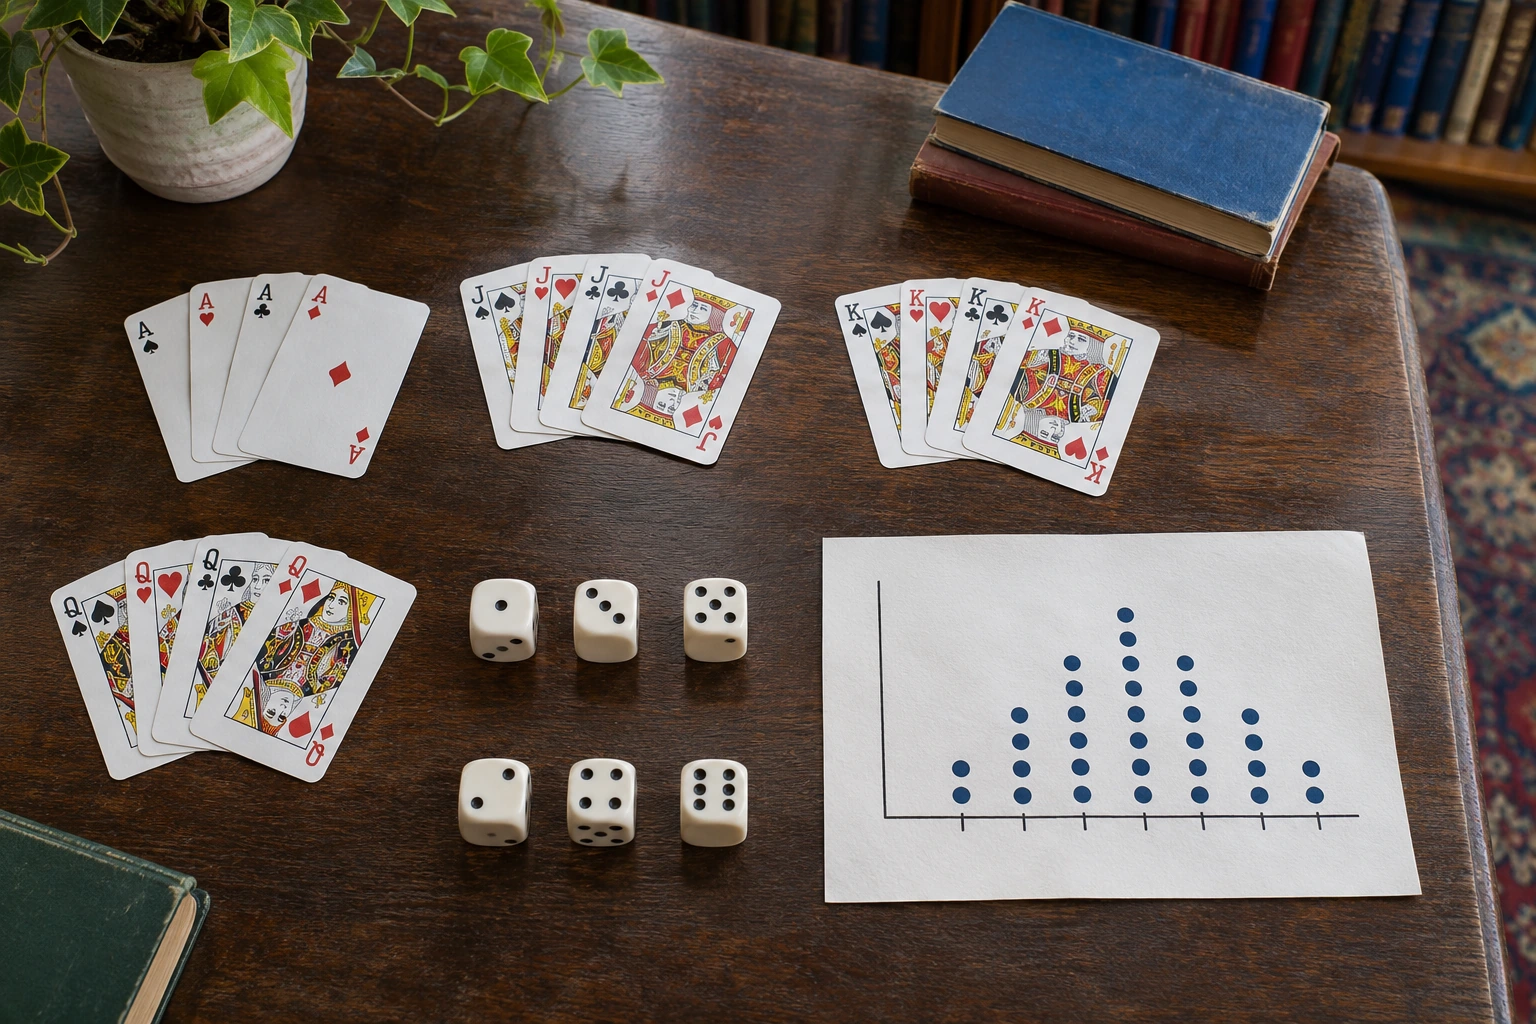
The phrase “equally likely” matters. A fair six-sided die has six equally likely faces, but the sums of two dice are not equally likely. There is one way to roll a total of 2 and six ways to roll a total of 7. Counting the 11 possible sums as if each had the same chance would produce the wrong answer.
| Winning event | Calculation | Probability |
|---|---|---|
| Heads on a fair coin toss | 1 ÷ 2 | 50% |
| A six on one fair die | 1 ÷ 6 | 16.67% |
| A total of 7 on two fair dice | 6 ÷ 36 | 16.67% |
| An ace from a shuffled 52-card deck | 4 ÷ 52 | 7.69% |
| Illustrative six-from-40 draw top-prize, one line | 1 ÷ 3,838,380 | About 0.0000261% |
| Illustrative six-from-40 plus bonus-ball draw top-prize, one line | 1 ÷ 53,737,320 | About 0.00000186% |
These are theoretical probabilities under the stated game rules. An observed win rate is different: 18 wins in 100 recorded plays gives an empirical frequency of 18%, not proof that the next play has an 18% chance. Historical data are most informative when the rules and playing conditions remain comparable.
Define “winning” before comparing odds
The same game can have several correct winning probabilities because different questions describe different events:
- Any prize: a round returns something, even when the payment is smaller than the stake.
- Break-even or better: the total return equals or exceeds the amount staked.
- Net profit: the return exceeds the stake after relevant costs.
- Top prize or jackpot: the precise combination needed for the largest prize occurs.
- Match or tournament win: a player or team finishes ahead of opponents under the scoring rules.
A slot machine round returning £0.40 on a £1 stake registers a payout but leaves a £0.60 loss. A hypothetical lottery line that matches three numbers may qualify for a lower division without winning top-prize. A team winning a match is a different event from a bet on that team producing a profit at the odds offered.
Probability versus odds: convert the figures correctly
Probability compares winning outcomes with all outcomes. Odds in favour compare winning outcomes with losing outcomes; odds against reverse that ratio. If an event has probability p, its mathematical odds in favour are p : (1 − p), and its odds against are (1 − p) : p.
A probability of 25% is equivalent to odds of 1:3 in favour or 3:1 against. “1 in 4” is a probability statement, not the same notation as odds of 1:4. For odds against of a:b, the winning probability is b ÷ (a + b).
Betting markets often display decimal odds instead. A price of 2.50 offers a total return of £2.50 per £1 staked if the selection wins, including the original stake. Its implied break-even probability is 1 ÷ 2.50 = 40%. That is a calculation from the offered price, not an independent measurement of the event's true chance.
How lottery winning probabilities are calculated
For a hypothetical draw of six distinct numbers from 40, order does not matter. The number of possible lines is C(40, 6) = 3,838,380, so one line has a 1 in 3,838,380 chance of matching all six main numbers. Adding an independent choice from 14 equally likely bonus balls changes the top-outcome count to 3,838,380 × 14 = 53,737,320.
Those figures illustrate combinations and independent events. The odds for any real lottery depend on its published number range, draw format and prize rules.
Do extra tickets or attempts increase the chance of winning?
More distinct combinations in the same hypothetical lottery draw cover more of the available sample space. Ten different six-number lines give a top-prize probability of 10 ÷ 3,838,380, or 1 in 383,838, for that draw. Buying the identical six-number line twice does not cover a second outcome: the probability of at least one winning selection stays the same. Duplicate entries, where permitted, affect potential payments rather than the chance that the combination appears.
Separate, independent attempts require a different calculation. If the chance of success on each trial is p, the probability of at least one success across n independent trials is:
P(at least one win) = 1 − (1 − p)n.
On a fair die, the chance of at least one six in four independent rolls is 1 − (5/6)4 ≈ 51.77%. Four rolls do not guarantee a six. For repeated lottery draws, the same formula applies when each draw is independent and the per-line probability remains constant.
The distinction between coverage and repetition is easy to miss. Ten distinct selections in one draw are mutually exclusive jackpot-winning selections for a fixed result. Ten plays across independent draws are separate trials. Their probabilities are very close when each individual chance is tiny, but the underlying models are not identical.
When independence, conditional probability and card removal matter
Events are independent when one result does not change the probability of another. Fair coin tosses and independent dice rolls meet that condition. A fresh random slot machine spin is not made more favourable by the previous spin's loss.
Events are dependent when earlier outcomes change what remains possible. A standard deck contains four aces. The chance the first card is an ace is 4/52, or 7.69%. If that ace is kept out of the deck, the chance the second card is also an ace becomes 3/51 ≈ 5.88%. If the card were replaced and the deck reshuffled, the chance would return to 4/52.
That distinction is described by conditional probability, P(A | B): the chance of event A when event B is already known to have happened. Card games, draws without replacement and player-versus-player decisions often need conditional probabilities rather than a simple count of equally likely outcomes.
Probability of winning is not expected value
A game with a frequent win can still have a negative financial expectation. Expected value (EV) combines each possible net result with its probability:
EV = Σ [probability of outcome × net gain or loss from outcome].
Consider a hypothetical £1 dice bet that returns £5 in total when a six is rolled and nothing otherwise. A win makes £4 net profit; a loss costs £1. The calculation is:
EV = (1/6 × £4) + (5/6 × −£1) = −£0.1667 per £1 bet.
The probability of a payout is still 16.67%. The average theoretical net result is a loss of about 16.7 cents per bet. Different games could produce the same win probability with different EVs, or similar EVs with radically different frequencies and prize sizes.
A positive EV is a mathematical property of an accurately modelled set of probabilities and payouts, not a promise of profit during any particular session. For a game with fees, commissions or multiple prize levels, the full payout schedule and all costs must enter the calculation.
RTP, house edge, hit frequency and volatility
Electronic gaming machines—commonly called slot machines in the UK—use game rules, virtual reels or symbols, paylines and a payout table to determine prizes. A random number generator (RNG) selects outcomes according to the game's design. Which symbols appear, and how often prizes occur, are separate questions from the average monetary return.
Return to player (RTP) measures the theoretical proportion of total stakes returned as prizes over extensive play. For a fixed-paytable game, its mathematical complement is the house edge:
House edge = 100% − theoretical RTP.
At an illustrative 96% RTP, the theoretical house edge is 4%. £100 in cumulative stakes carries an expected loss of £4 under the model; it does not promise that any individual player will get £96 back. Reusing earlier winnings for more spins increases cumulative turnover without necessarily adding more money to the machine.
| Measure | What it answers | What it does not tell you |
|---|---|---|
| Win probability | How often a specified outcome occurs | Whether the reward exceeds the stake |
| Hit frequency | How often a round pays a prize | How large those prizes are |
| RTP | Expected total prize return as a share of turnover | The outcome of a short session |
| House edge | Expected player loss as a share of turnover | The fraction of players who lose |
| Volatility / variance | How widely results can vary around the mean | Whether a payout is due next |
High-volatility games can concentrate returns in rare, large prizes. Low-volatility games can pay smaller prizes more often. A displayed RTP of 96% cannot be converted into a 96% chance of winning a spin, and two games with the same RTP need not have the same hit frequency or jackpot probability. Game-specific paytables, symbol distributions, bonus features and progressive jackpot rules are needed for that level of detail.
Sports betting odds and the bookmaker's overround
For a simple fixed-odds bet with decimal price d and assessed win probability p, the expected net return per £1 staked is p × d − 1, before other deductions. At odds of 2.50, a genuine 40% chance would give a break-even expectation. Assessing a team at 45% instead produces (0.45 × 2.50) − 1 = +£0.125 in theoretical EV per £1—only if that 45% estimate is sound.
Quoted prices generally include a bookmaker's margin. If both outcomes in a two-way market are priced at 1.90, each has an implied probability of 1/1.90 ≈ 52.63%. Together they total 105.26%. The 5.26-percentage-point excess is the overround, not a measured 105.26% chance of either outcome occurring. It is also not automatically the bookmaker's realised profit rate: actual results depend on the true probabilities and how stakes are distributed.
An accumulator multiplies the quoted decimal prices of its legs, but every required result must occur. Multiplying individual win probabilities is valid only when those events are independent. Related outcomes within the same match need a joint-probability model; treating them as unrelated can make a combined bet look much more likely than it is.
Where game strategy can—and cannot—change the odds
Some results are determined almost entirely by chance; others also depend on decisions, opponent behaviour and game state. The correct model changes with the game.
| Game type | Main probability inputs | Decision that matters |
|---|---|---|
| Coin toss and dice games | Fairness of the equipment; winning conditions | Compare the rule and payout with the outcome count |
| Lotteries, bonus-ball draws and raffles | Number of combinations; distinct entries; prize rules | Distinguish jackpot odds from any-prize odds |
| slot machines and other random-result games | RNG model; paytable; hit frequency; RTP; volatility | Assess expected cost and variability, not streaks |
| Poker | Cards known; unseen cards; opponents; betting actions | Use conditional probabilities and assess the full hand |
| Blackjack | Table rules; deck composition; dealer upcard; player choices | Compare decisions against the applicable strategy model |
| Sports and esports markets | Estimated outcome probabilities; decimal odds; margin | Check whether the offered payout justifies the risk |
In poker, a player holding four cards of one suit after the flop has nine remaining cards of that suit in a standard 52-card deck. With 47 unseen cards, the chance of completing that flush on the next card is 9/47 ≈ 19.15%. Across the next two cards, with no further card removal and no relevant extra information, the chance is 1 − (38/47 × 37/46) ≈ 34.97%. Completing the flush is not the same event as winning the hand: an opponent may hold a stronger hand.
Skill-based play can alter a person's chance of beating an opponent; it cannot overturn a genuinely random draw through lucky numbers, timing a spin or changing the stake after a loss. A Martingale staking pattern changes bet sizes and exposure, not the underlying chance on the next independent trial. Table limits, limited funds and large losses make such progression systems particularly risky.
Win streaks, losing streaks and the gambler's fallacy
Random sequences often contain clusters. Five consecutive losses do not make the sixth independent attempt more likely to win. The belief that a result is “due” after a streak is the gambler's fallacy. Its opposite—assuming a winning streak will continue merely because it has occurred—is equally unsupported when trials are independent.
The binomial distribution describes the number of wins in a fixed number of independent trials when the chance of winning remains constant. The chance of exactly k successes in n trials is:
P(X = k) = C(n, k) × pk × (1 − p)n − k.
For five fair-die rolls, the chance of rolling exactly two sixes is C(5, 2) × (1/6)2 × (5/6)3 ≈ 16.08%. Other outcomes remain entirely plausible. Long-run averages do not create a deadline by which a particular player must recover losses.
A computer Monte Carlo simulation can test an assumed model by generating many synthetic games and checking the observed proportions. It cannot repair incorrect rules or establish a reliable true win probability from a small, biased sample of past results.
What to check before trusting a stated winning percentage
- Find the exact event. Does “win” mean any payout, net profit, a jackpot, or victory over another player?
- Read the current rules. Check the draw matrix, bonus conditions, number of decks, game variant, prize divisions and any recent change.
- Identify the probability model. Are outcomes equally likely? Are trials independent? Are cards removed? Does skill or an opponent matter?
- Compare the payout with the stake. Convert odds carefully and calculate EV when the full outcomes and paytable are available.
- Separate short-run experience from theoretical averages. Check RTP, volatility, sample size and whether reported figures are theoretical or observed.
Exact probabilities are not always available. A game that omits its full paytable, selection mechanism or rules cannot be modelled precisely from a marketing claim alone. More wins do not automatically make one game fairer; the distribution of losses, prize amounts and total stakes supplies the missing information.
Questions that change the answer
Is choosing 1, 2, 3, 4, 5, 6 worse than choosing random hypothetical lottery numbers?
No. In a fair six-from-40 draw, every distinct six-number combination is equally likely. An obvious pattern and an irregular selection have identical top-prize probabilities. The pattern may affect how many other people select it, which matters when a prize is shared.
Does a 1 in 20 chance mean a win will arrive within 20 attempts?
No. If each attempt is independent with a 5% chance, the probability of at least one win in 20 attempts is 1 − 0.9520 ≈ 64.15%. There is still about a 35.85% chance of no wins across those attempts.
Could buying every hypothetical lottery combination guarantee a profit?
Covering all 3,838,380 distinct standard hypothetical lottery combinations would guarantee that one line matches the six main balls in a valid draw, assuming every combination is successfully entered. It would not guarantee a financial profit. Ticket costs, divided jackpots, lower-tier payments, transaction restrictions and other conditions still govern the net result.
Can a game have high RTP and a low chance of winning?
Yes. RTP concerns the total expected value of payouts. A game can concentrate much of that value into infrequent prizes, producing a low hit frequency and substantial volatility. A second game with the same RTP may distribute its returns across many small wins.
The mathematical limit of a winning strategy
A sound probability calculation identifies the event, counts or estimates its possible outcomes, then considers the financial or competitive consequence. It does not remove randomness. In the UK, a large lottery jackpot, an appealing slot machine payline and attractive decimal odds answer different questions; their percentages become comparable only after the winning condition, stake, payout structure and game rules are aligned.
Gambling can cause harm. For information about gambling support in Great Britain, see the NHS gambling support guidance.