
A fair coin can land heads 60 times in 100 tosses. Two dice are far more likely to total 7 than 12. Twist a strip of paper before taping its ends together and it has only one side. Each surprise gives you a prediction to test with ordinary materials.
A coin, two dice, counters, paper and a ruler cover most of the activities. Write down your predictions and tally what happens. The games suit home learning, classroom maths rotations and science labs in the UK.
Which maths experiment should you choose?
Match the question to the method. Chance needs repeated trials, lengths need consistent units, and a pattern needs a construction or argument that goes beyond its first few examples.
| Experiment | Main maths idea | What you need | Approximate time |
|---|---|---|---|
| Coin-toss challenge | Probability, relative frequency, sample size | Coin, paper | 15–25 min |
| Two-dice fairness game | Sample space, likelihood, game design | Two dice, counters | 20 min |
| Mystery bag | Sampling, proportions, inference | Opaque bag, coloured counters | 15–20 min |
| Build a spinner | Fractions, angles, experimental probability | Card, protractor, paper clip | 20–30 min |
| Circle detective | Diameter, circumference, ratio, π | Round objects, string, ruler | 15–20 min |
| Growing squares | Number sequences, square numbers, algebra | Tiles or LEGO bricks | 10–15 min |
| One-sided paper loop | Topology, surfaces, prediction | Paper, tape, pencil, scissors | 15 min |
| Grid-route race | Combinations, logical reasoning, algorithms | Squared paper, pencil | 15–20 min |
Younger tamariki can start with coin tosses, tile squares or a spinner. Fractions and percentages help learners predict chance outcomes; algebra and systematic counting suit more advanced investigations.
Run the lab like a mathematician
A useful statistical enquiry cycle is Problem, Plan, Data, Analysis and Conclusion (PPDAC). It helps a class keep one question, one method and a clear record of results.
- Problem: Ask a question with an observable answer. Is the game fair? Does a larger circle have a different circumference-to-diameter ratio?
- Plan: State a prediction and decide what counts as one trial. Keep the rules, measuring method and recording categories consistent.
- Data: Record every valid outcome in a tally table. Agree on how to handle dropped dice or incomplete spins before starting.
- Analysis: Compare frequencies with predictions. Use fractions, decimals, percentages, a bar graph or a line graph where they clarify the result.
- Conclusion: Answer the original question, describe uncertainty and identify one change worth testing.
For a classroom chance experiment, compare running proportions after 20 and 100 throws rather than treating either batch as a guaranteed 50:50 split. More trials can reveal a long-run pattern, while the exact probability still comes from the model.
An experiment can expose a pattern without proving it. A mathematical conjecture needs a logical argument to establish a general rule. One valid counterexample is enough to disprove a universal claim.
1. Coin-toss challenge: Is 50:50 a promise?
Question: Is exactly 50 heads guaranteed in 100 tosses of a fair coin?
Materials: A coin, pencil and tally sheet. A calculator helps with percentages.
- Predict the number of heads in 20 tosses; write it down before the first throw.
- Toss the coin 20 times, recording heads (H) and tails (T) after every throw.
- Calculate the experimental probability: number of heads ÷ total tosses.
- Continue to 100 tosses. Record the running percentage every 10 tosses and plot it on a line graph.
- Mark 50% on the graph and compare it with your running percentages.
A fair coin gives heads with theoretical probability 1/2 = 0.5 = 50%. The relative frequency is the number of heads divided by the number of tosses, and it varies from one set of trials to the next. Four heads in a row do not make tails more likely on the following independent toss.
Over many trials, the law of large numbers says that the recorded proportion tends towards the true probability. It does not promise that each additional batch brings the figure closer to 50%.
Game variation: One player predicts the exact number of heads in 10 tosses; another predicts a range. Record hits over five rounds. Wider ranges tend to hit more often, so the prediction rules must be agreed before comparing results.
2. Two-dice game: Which winning rule is fair?
Question: Player A scores when two dice total 7. Player B scores on 2 or 12. Does having two winning totals give B the edge?
Materials: Two ordinary six-sided dice, a score sheet and counters. Use tokens rather than money or cash prizes.
- Agree that totals other than 2, 7 and 12 score no points. Predict which player will win more often.
- Roll both dice 60 times. Record each total from 2 to 12 and the number of wins for each player.
- Draw a 6 × 6 grid showing every ordered pair of die faces. Count how many pairs produce each winning total.
- Redesign the rules so both players have the same mathematical chance, then test the new game.
Two dice have 36 equally likely ordered outcomes. Six of them total 7: (1,6), (2,5), (3,4), (4,3), (5,2) and (6,1). There is just one way to throw a 2 and one way to throw a 12. A scores with probability 6/36 on each roll; B scores with 2/36. A's scoring event is three times as likely.
Fair-game redesign: Keep 7 for A. Give B totals 2, 3 and 4, which occur in 1 + 2 + 3 = 6 ordered ways. Every other total scores nothing. Each player now has a 6/36 chance of scoring per roll; a short game can still end with unequal scores.
With two dice, the sample space contains 36 face pairs. Counting the winning numbers printed in the rules misses how often each total can occur.
3. Mystery bag: Can you estimate what you cannot see?
Question: Can blind draws reveal the proportions of colours hidden in a bag?
Materials: An opaque bag, 10 counters in two or three colours, and a tally sheet.
- One person puts 10 counters into the bag without showing the colours or quantities.
- Another person draws one counter, records its colour, replaces it and mixes the bag before the next draw.
- After 20 draws, estimate the proportion of each colour. Repeat until the total reaches 50 or 100.
- Open the bag and compare the estimated proportions with the actual composition.
Why replacement matters: Put the counter back after noting its colour. The bag's mix then stays unchanged between draws. If you keep counters out, the proportions shift, making each later draw a different probability problem.
If 18 of 30 draws are red, the estimate is 18/30 = 0.60 = 60%. That does not prove six of the ten counters are red. A small random sample can give a misleading picture of the bag.
Challenge: Compare estimates after 20 and 100 draws. In a two-colour bag, “not red” is the complement of “red”, so their probabilities add to 1.
4. Design a spinner with fractions and angles
Question: Can a homemade spinner deliver the probabilities written in its design?
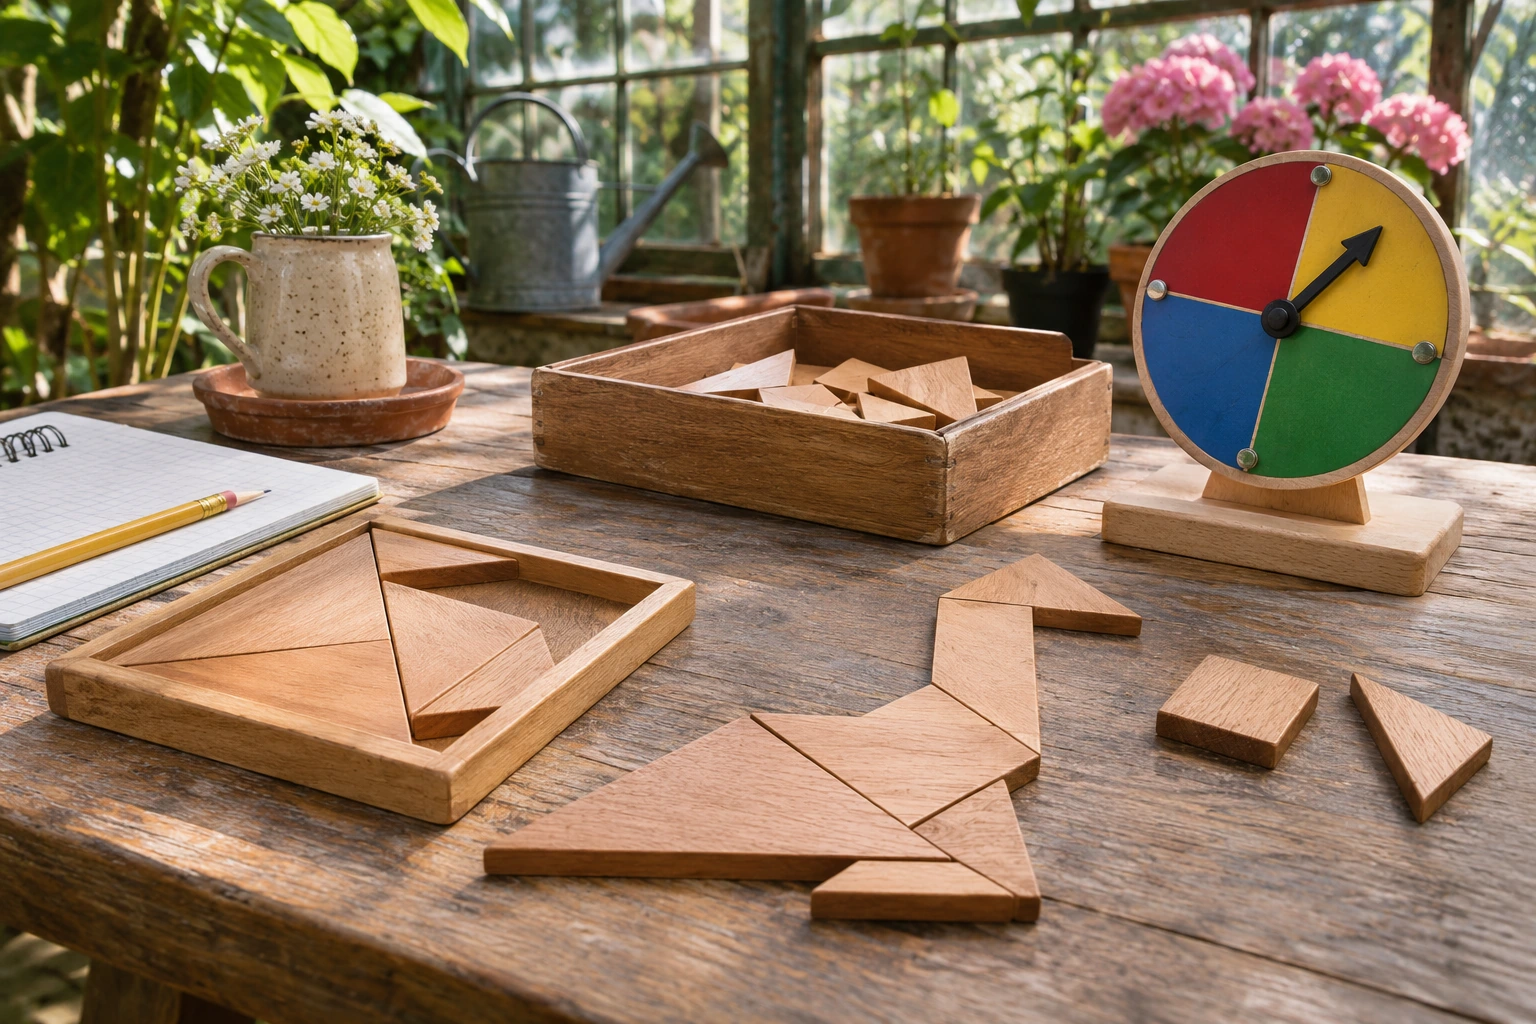
Materials: Card, pencil, ruler, protractor, coloured pens and a paper clip that turns around a pencil point.
- Draw a circle. Assign four colours the probabilities 1/2, 1/4, 1/8 and 1/8.
- Convert each fraction into a sector angle by multiplying by 360°.
- Mark sectors of 180°, 90°, 45° and 45°. Check that the angles total 360°.
- Spin 40 times, record each result and compare the frequencies with the expected proportions.
- Replace the sectors with four 90° sectors. Spin another 40 times and compare each colour's frequency with the expected 1/4.
For a freely turning, unbiased spinner, each sector's share of the full circle gives its theoretical probability: sector angle ÷ 360°. A larger sector should come up more often than a smaller one.
Four equal 90° sectors model equal chances for four colours. A wobbly pivot, friction or an uneven card can spoil that symmetry in a real spinner. A digital spinner tests the probability model; cardboard also tests how well the spinner was made.
5. Circle detective: Find π with a ruler
Question: Will a plate and a small lid give the same circumference-to-diameter ratio?
Materials: Three or more round objects, such as a jar lid, plate and tape roll; string, a metric ruler and calculator.
- Measure the diameter of each object straight across its centre in centimetres.
- Wrap string once around the rim. Mark its length and measure it against the ruler to estimate the circumference.
- For each circle, divide circumference by diameter. Record the result to two decimal places.
- Compare the ratios. Plot diameter on the horizontal axis and circumference on the vertical axis.
For any true circle, circumference ÷ diameter = π, about 3.14159. A circle with a 10 cm diameter has a circumference of roughly 31.4 cm. When circumference is plotted against diameter, the relationship is C = πd.
If the ratios differ, check for a stretched string, thick rim or diameter measured off-centre. Remeasure each object; π has not changed.
6. Growing squares: Predict the next number
Question: How many extra tiles enlarge an n by n square by one row and one column?
Materials: Square tiles, LEGO bricks or equal-sized paper squares.
- Build squares measuring 1 × 1, 2 × 2, 3 × 3 and 4 × 4 tiles.
- Count the tiles: 1, 4, 9, 16. Predict the count for a 5 × 5 square before building it.
- Record the gaps between consecutive totals: 3, 5, 7. Predict the next gap.
- Show the added tiles as a new border along two sides of the existing square.
An n by n square uses n2 tiles. Enlarging it adds 2n + 1, the next odd number. A row and a column form the new border, with the shared corner counted once. In algebra, n2 + 2n + 1 = (n + 1)2.
Game variation: Show players 1, 4, 9, 16 without the square models. Ask them to predict 25 and then build the next square. Many rules fit four numbers; the tile construction gives a reason for this rule to continue.
7. One-sided paper loop: A topology surprise
Question: Can a paper loop have just one side and one edge?
Materials: Two long paper strips, tape, pencil and scissors. Younger children need adult help with cutting.
- Tape the ends of the first strip together without twisting. Trace a line along its middle: the pencil stays on either the outside or inside surface.
- Give the second strip one half-turn (180°) before taping its ends together. This creates a Möbius strip.
- Without lifting the pencil, trace a line along the middle until it returns to the starting point. Notice that the line travels over what initially appeared to be both sides.
- Predict what a cut along the centre line will produce. Cut carefully all the way around.
The ordinary untwisted loop has two sides and two separate boundary edges. A Möbius strip has one continuous side and one boundary edge. Cut the Möbius strip along its centre line and you get one longer connected loop, not two rings.
Topology studies properties preserved by bending or stretching without tearing or joining. Trace the ordinary loop and the half-twisted loop before cutting; the pencil line reveals the difference between their surfaces.
8. Grid-route race: How many shortest paths exist?
Question: How many shortest east-and-north routes cross a grid three steps wide and two steps high?
Materials: Squared paper, a pencil and two coloured counters.
- Mark the starting point at (0,0) and the finish at (3,2). Travel only east or north along grid lines.
- Find several routes. Each shortest route contains exactly three east steps and two north steps.
- Write each route as a five-letter code, such as EEENN or ENENE. Count unique codes without repeating any.
- Place a blocked intersection at (1,1) and count how many of the shortest routes still work.
A shortest route uses three east steps and two north steps. Choose two of the five positions for north: 5! ÷ (3! × 2!) = 10 routes. Six pass through the blocked point (1,1), because there are two ways to reach it and three ways to continue to (3,2). That leaves 10 − 6 = 4 shortest routes avoiding the block.
Game variation: One player adds an obstacle; the other predicts how many shortest routes remain before listing them. The puzzle uses grid coordinates, combinatorics and path-finding algorithms.
When physical experiments and simulations disagree
Mathigon's dice simulation shows how often two-dice totals appear across thousands of virtual throws. A spreadsheet can generate random values, tally the totals and graph the running frequency.
A simulation follows the probabilities programmed into it. It cannot tell you whether a real die is uneven or a cardboard spinner catches at one angle. Physical trials test the object; digital trials test the ideal model.
| Unexpected result | Useful check |
|---|---|
| A fair coin produces a long streak of heads. | Check that each toss was recorded; a streak alone does not show the coin is biased. |
| Some dice totals barely appear. | List all 36 ordered pairs and compare larger sets of trials. |
| A homemade spinner strongly favours a colour. | Check sector angles, the pivot and whether it spins freely. |
| A measured circle gives a ratio far from π. | Remeasure the diameter through the centre and the string around the rim. |
| A number pattern works in the first few cases. | Look for a construction or algebraic argument that justifies the general rule. |
Keep the tally sheet when the numbers look strange. A missed roll or a ruler that slipped is easier to spot in the original record than in a graph.